Tutorial
This tutorial describes how to set up a local instance of HiGlass and load some common data types.
Prerequisites
To follow the steps in this tutorial you will require the following software packages:
- Docker (https://www.docker.com/community-edition): Docker is program that lets you run “containers” hosting software and its dependencies
- Python
higlass-manage: This package is a wrapper for the Docker commands used to run a local instance. It can be installed usingpip install higlass-manage. Brief documentation can be found at its GitHub project page
Quickly viewing a dataset
The simplest way to get started is to open and view a dataset. The
higlass-manage view command will automatically start a new instance if one
isn’t already running, add the given dataset and display it in a browser.
Currently, the higlass-manage view command only works with cooler, bigWig,
chromsizes and gene-annotation files.
higlass-manage view my_file.mcool
To view multiple datasets, see the Adding data section below.
Running HiGlass locally
We can start a local HiGlass instance using higlass-manage:
higlass-manage start
This will create what is essentially a mini virtual machine running on your
computer. This command creates a data directory at ~/hg-data. All of the
ingested data data will be stored there. An alternative directory can be specified
using the --data-dir parameter.
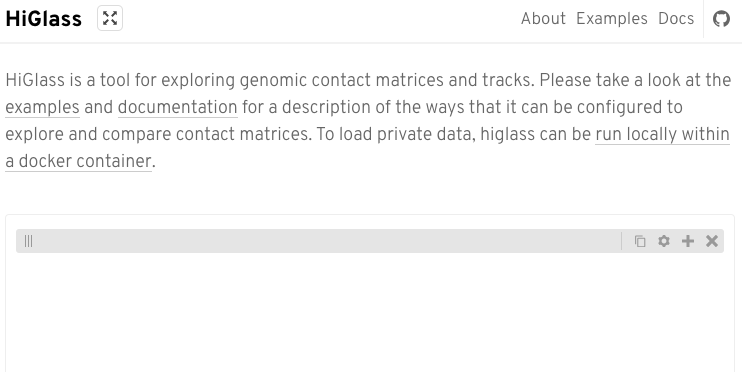
A screenshot of an empty HiGlass web page
This indicates that the Docker container has succesfully started and you have a HiGlass instance running on your computer.
Now to add some data…
Adding data
HiGlass supports a number of different data types.
Use the ingest command to add new data. Generally data requires a filetype and a datatype. This can sometimes (i.e. in the case of cooler and bigwig files) be inferred from the file itself.
higlass-manage ingest my_data.mcool
In other, more ambiguous cases, it needs to be explicitly specified:
higlass-manage ingest my_file.bed --filetype bedfile \
    --datatype bedlike --assembly hg19
Note that bedfiles don’t store chromosome sizes so they need to be passed in using either the --assembly or --chromsizes-filename parameters.
Viewing data in the client
To view the data we’ve added to our instance, we need to load the HiGlass
browser. This can be done by either opening a browser and navigating to
http://localhost:8989/app (using the port specified), or using:
higlass-manage browse
From there, we need to add the tracks:
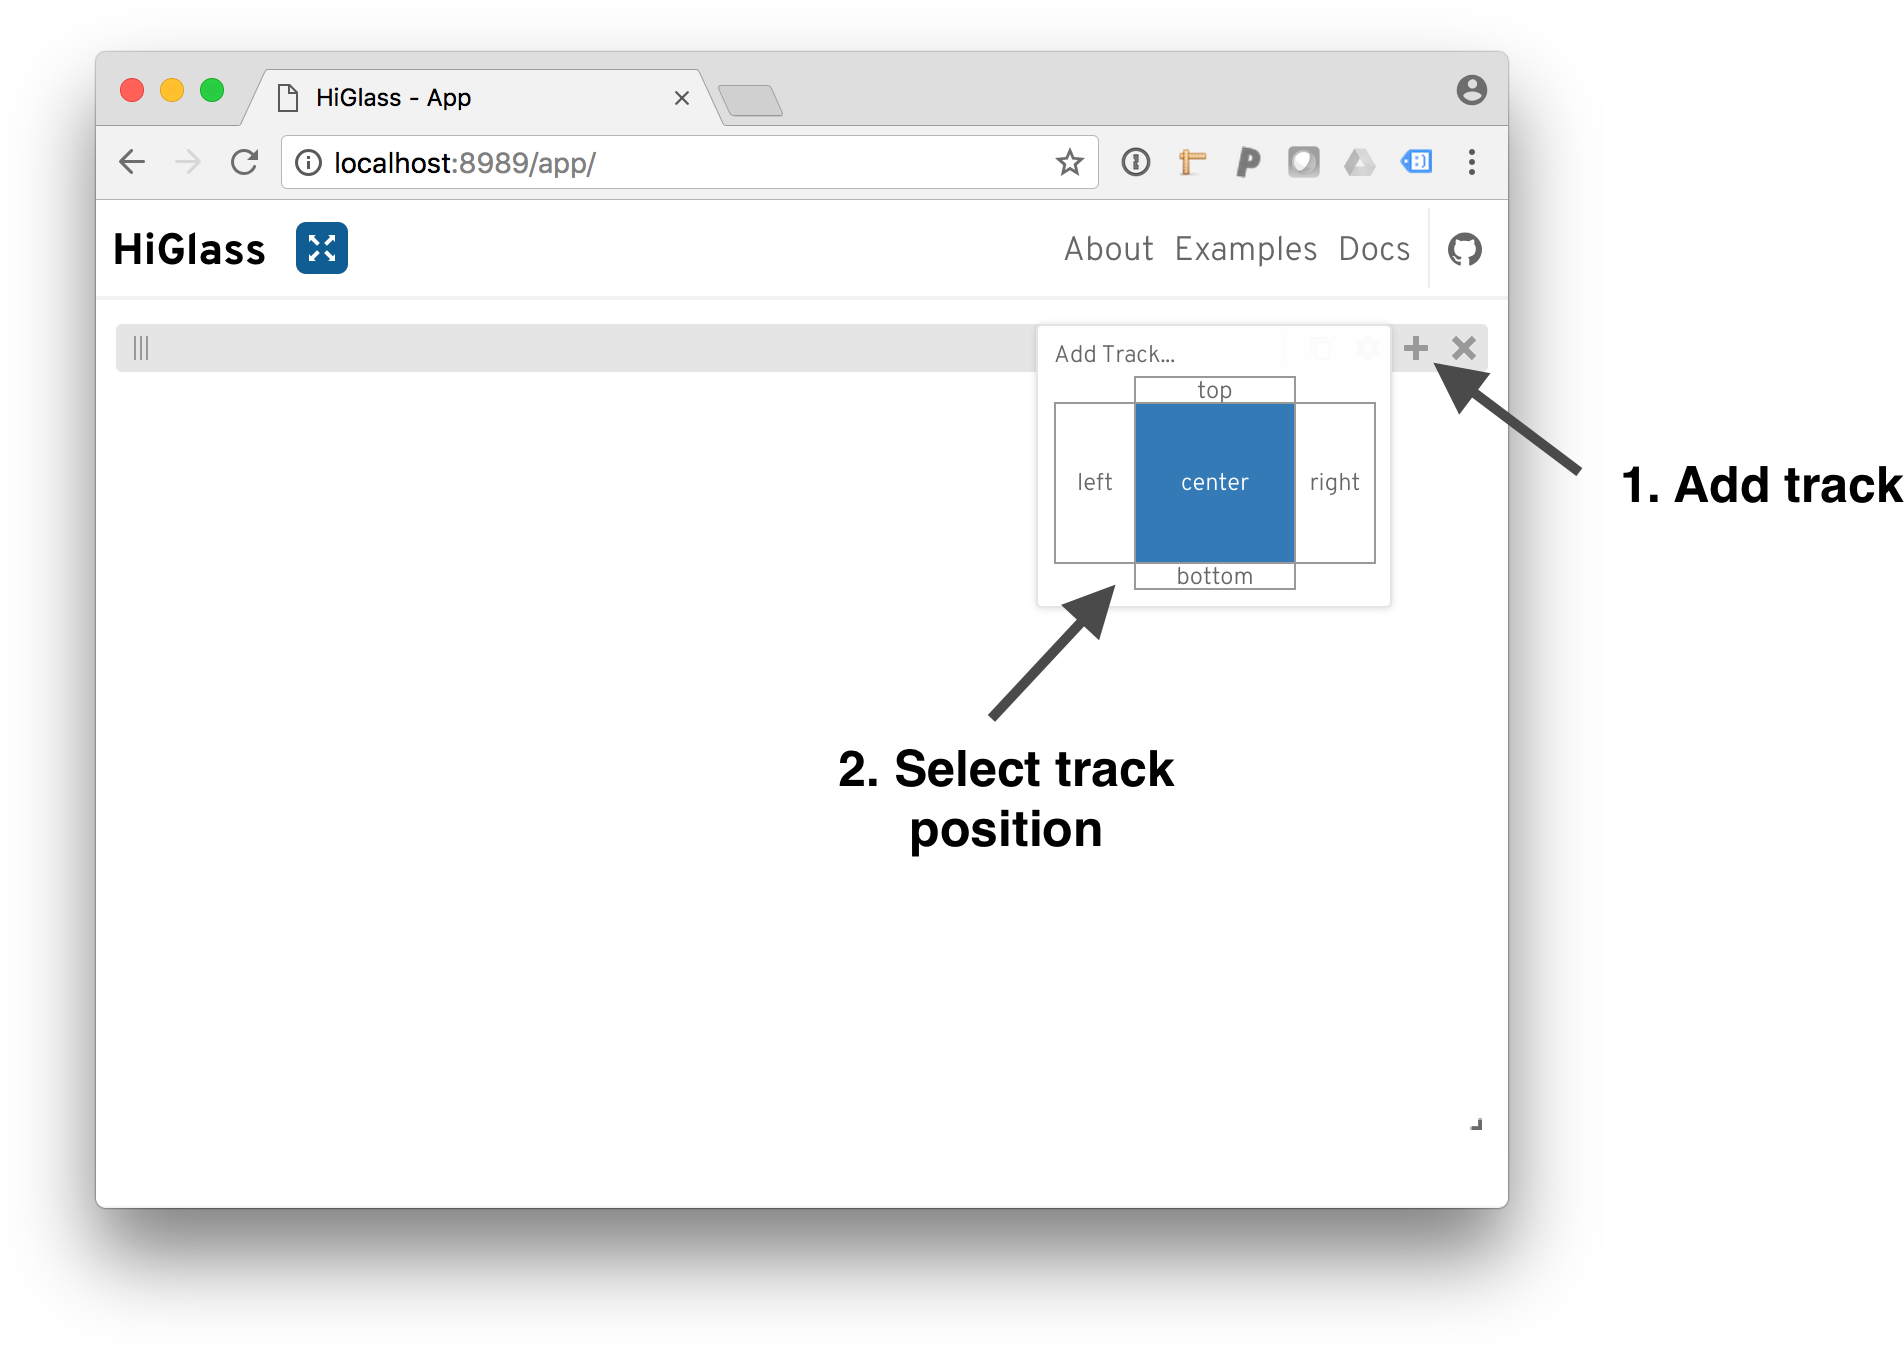
To add a track, click on the ‘+’ and select a track position.
After selecting a position, we need to select a dataset to add. The dialog shows both the local datasets as well as the public data available on http://higlass.io.
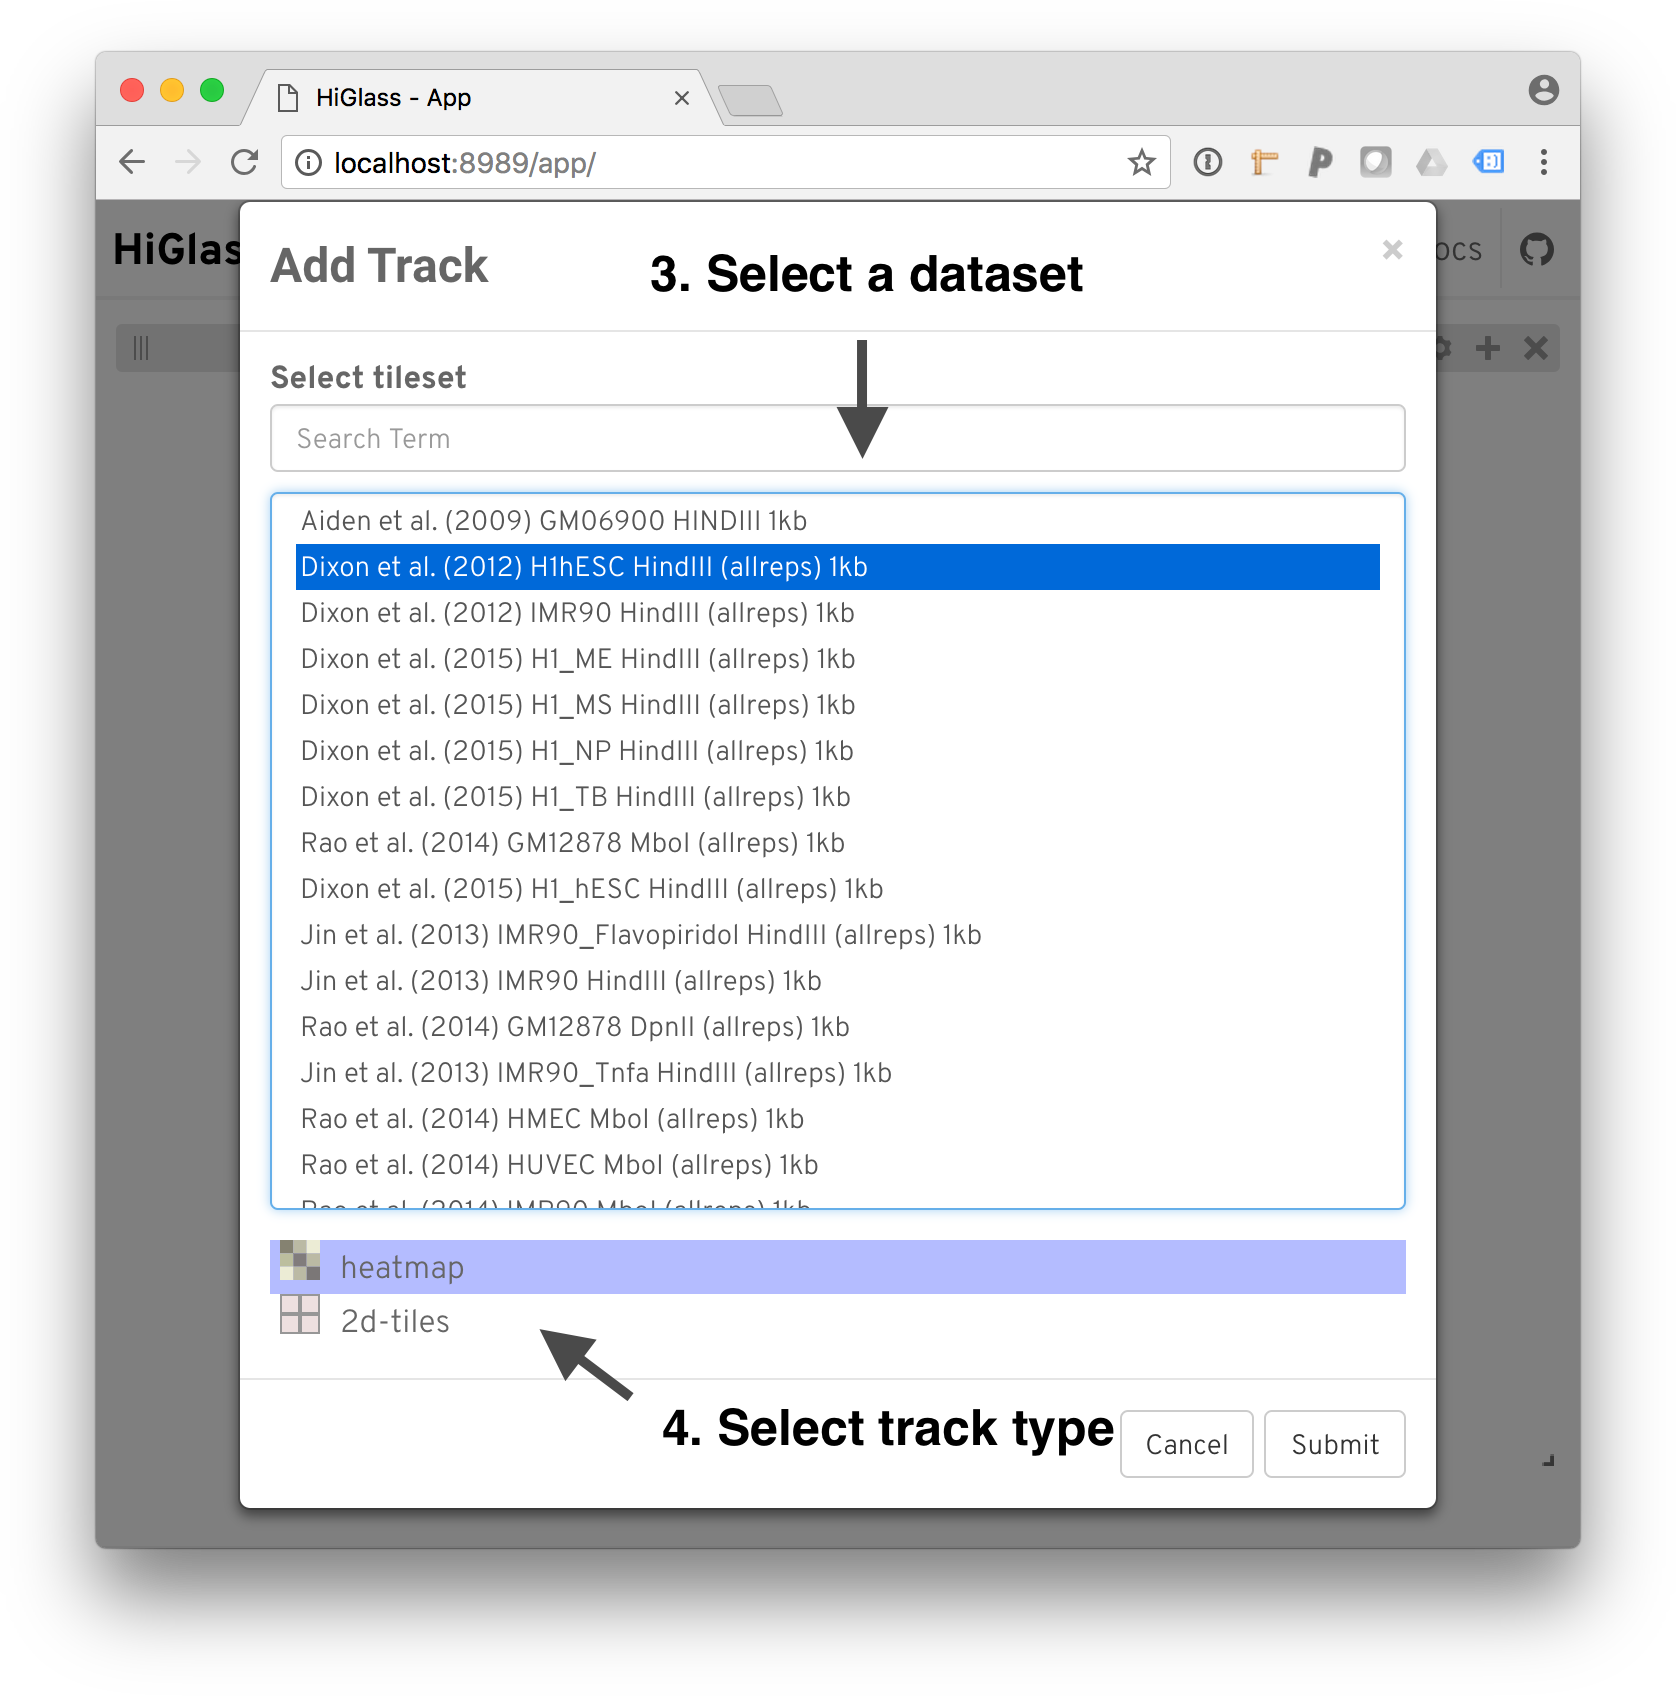
Select a dataset to add.
And we get our results
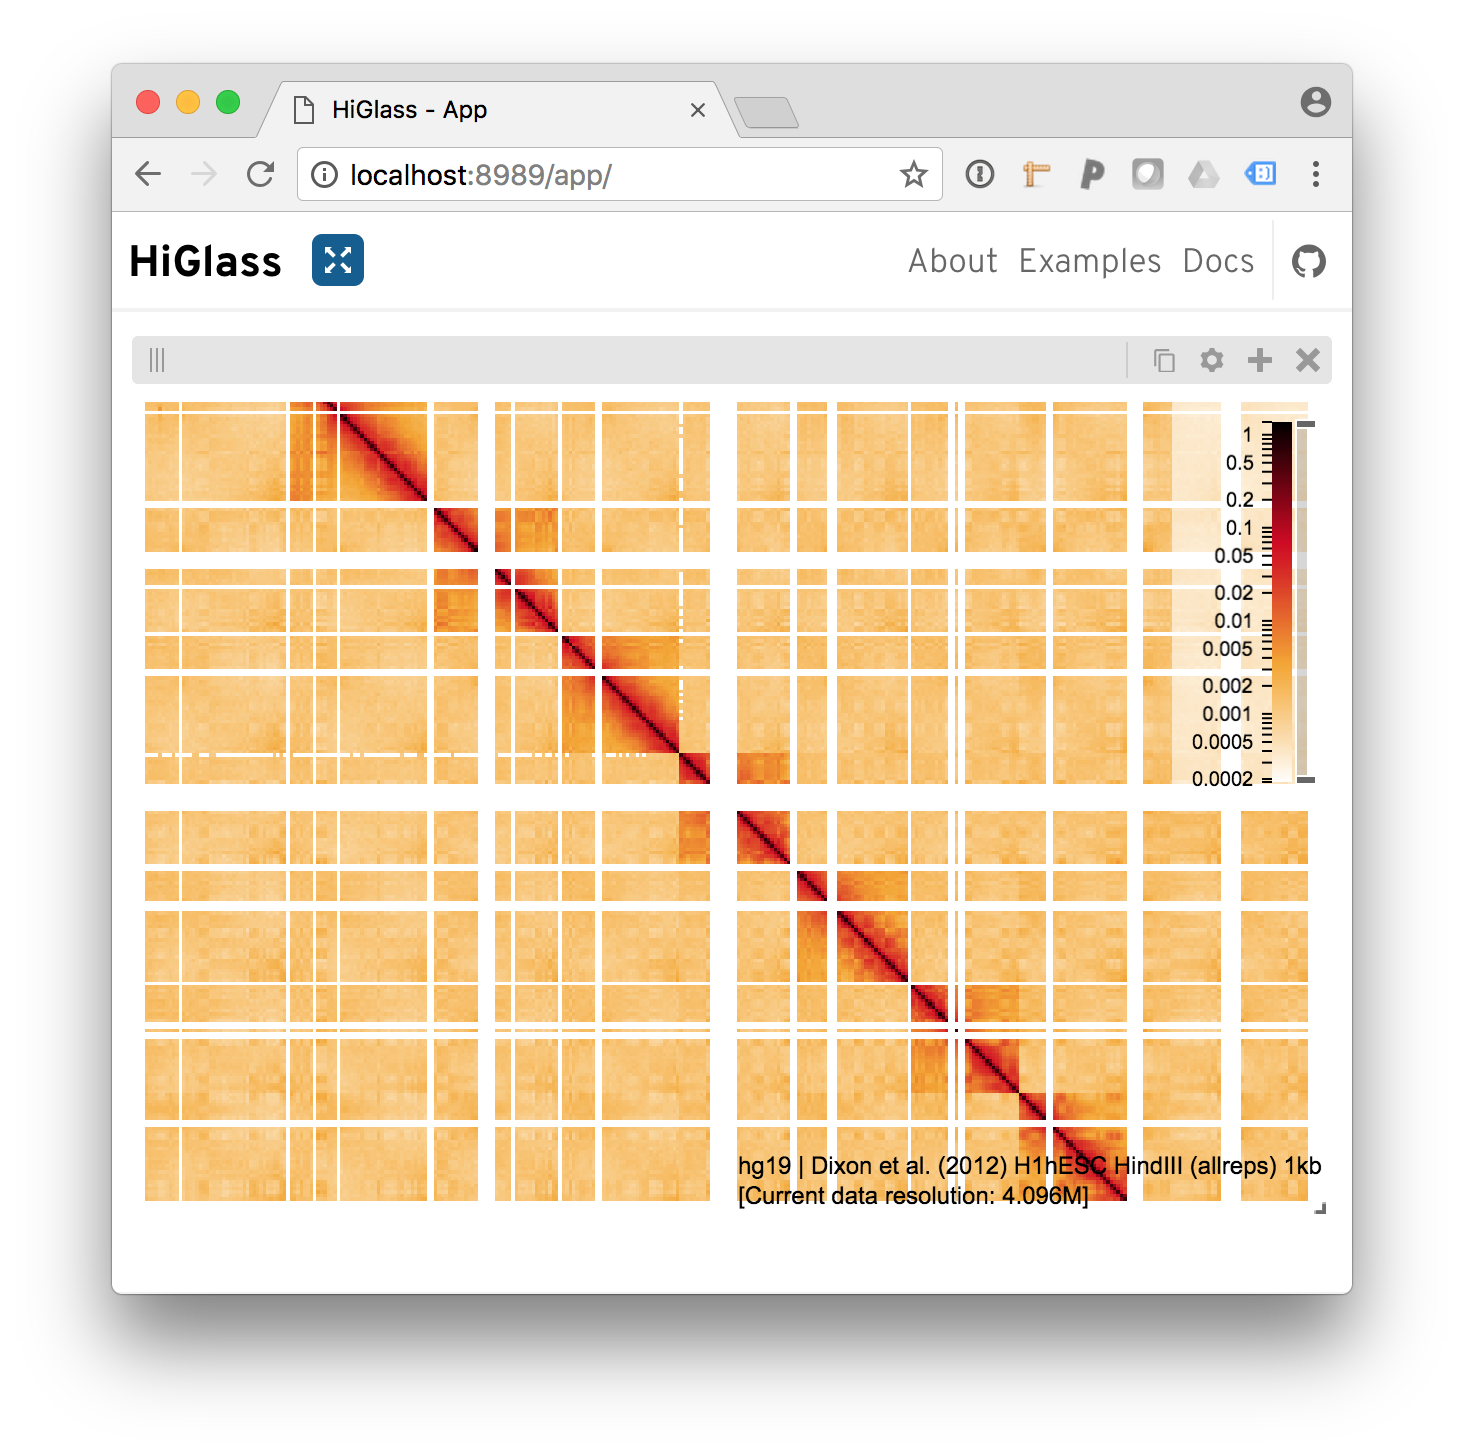
Behold the added heatmap.
The same procedure can be used to add bigwig files on the top, left, right and bottom positions of the view.