Track Types
Linking value scales
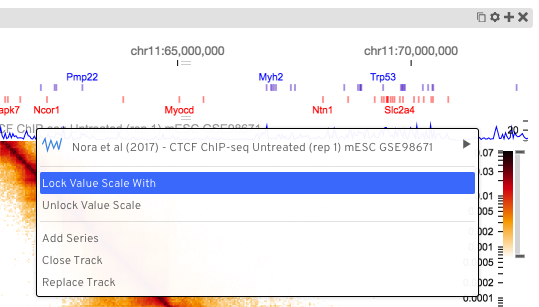
The scaling of values in quantitative tracks is done from lowest to highest values. Two tracks displaying different data will likely have different axis scales based on the extent of the data visible in each. To enable comparison between the two tracks, HiGlass supports locking value scales such that they both display the same axes. This can be done using the track configuration menu:
Bed-like

track-type: bedlike
datatype: bedlike
The bedlike track is intended to display generic interval data. It is used to render tracks with a bedlike datatype. This usually comes from the beddb filetype. Regular bed-like files can be converted to beddb using the instructions in the data preparation section.
Color Encoding:
Intervals can visually encode information using the following three options:
colorEncoding: bool [default false]- If
truethe interval value is used for color encoding. colorRange: array- A list of HEX colors that make up the continuous color map.
colorEncodingRange: array- A tuple defining the minimum and maximum range value for color encoding.
Here is an example snippet
{
  ...,
  colorEncoding: true,  // Turn on color encoding
  colorRange: [  // Define the color map
    '#000000', '#652537', '#bf5458', '#fba273', '#ffffe0'
  ],
  colorEncodingRange: [0, 0.5119949],  // Limit the encoding range
  ...
}
Gene Annotations

track-type: horizontal-gene-annotations
datatype: gene-annotations
Gene annotations display the locations of genes and their exons and introns. The tracks displayed on HiGlass show a transcript consisting of the union of all annotated exons in refseq. There are separate tracks for the different available species. Details on how gene annotation tracks are created is available in the gene annotations section.
Demos:
Heatmap

track-type: heatmap
datatype: matrix
Heatmaps in HiGlass are usually used to display HiC data. They log-scale input values and map them to a user-selectable color scale (color map configuration option). Because HiGlass displays data at varying zoom levels, heatmaps are displayed at different resolutions depending on the current zoom level. To limit the resolution of the displayed data, users can set the Zoom Limit configuration option.
Rotated 2D Heatmap

track-type: horizontal-heatmap
datatype: matrix
Rotated 2D heatmaps are regular 2D heatmaps sliced across the diagonal and rotated 45 degrees. The base of the heatmap is always the diagonal of the 2D heatmap. This is useful for displaying data, such as HiC, which has prominent features along the diagonal.
2D Rectangle Domain

track-type: 2d-rectangle-domains
The rectangle domains track shows rectangular regions on the heatmap. These are
commonly aggregated using clodius based on some importance using the clodius
bedpe command. See the data preparation section for an example of the aggregation
command.
higlass-manage ingest --filetype bed2ddb --datatype 2d-rectangle-domains annotations.bed2ddb
Horizontal 2D Rectangle Domain

track-type: horizontal-2d-rectangle-domains
datatype: 2d-rectangle-domains
Horizontal rectangle domains show a 45 degree rotation of rectangular domains on a 1D track. This track is most commonly used with domains that are close to the diagonal of the heatmap. Because the track is oriented so that the diagonal of the 2D view is situated along its base, rectangles far from the diagonal may be outside of the bounds of the track.
Line

track-type: horizontal-line
datatype: vector
Line tracks display 1D vector data. Because each line segment requires two adjacent points to be present, data with lots of NaNs may lead to a fragmented plot. For such data, the bar track or point track may be more appropriate.
Bar

track-type: horizontal-bar
datatype: vector
Bar tracks display 1D vector data as bars.
Demos:
- Diverging bars with color map and gradient <examples/bar-track-color-range.html>
Point

track-type: horizontal-point
datatype: vector
Point tracks display 1D vector data. Unlike line tracks, they are well suited to data with NaNs because they do not require two points to draw something.
1D Heatmap
track-type: horizontal-1d-heatmap and vertical-1d-heatmap
datatype: vector
1D heatmap tracks display 1D vector data. Unlike the other 1D tracks, they are well suited for getting an overview of distribution and less suited for identifying precise properties of individual data points. E.g., finding regions that are on average highly expressed is much easier than finding the highest peak with this track.
Example:
{
  server: 'http://higlass.io/api/v1',
  tilesetUid: 'e0DYtZBSTqiMLHoaimsSpg',
  uid: '1d-heatmap',
  type: 'horizontal-1d-heatmap',
  options: {
    labelPosition: 'hidden',
    colorRange: ['#FFFFFF', '#ccc6ff', '#4f3de5', '#120489', '#000000'],
  },
  height: 12,
}
Demo:
Chromosome Labels

track-type: horizontal-chromosome-labes
datatype: chromsizes
filetypes: chromsizes-tsv
The chromosome labels track shows the names of the chromosomes. Its data is sourced from a standard chromSizes file containing chromosome names and chromosome files. The file can be ingested by the higlass server like any other tileset. As long as the datatype is set to chromsizes this track should be selectable from the “Add Track Dialog”.
Demos:
Chromosome Grid

track-type: 2d-chromosome-grid
datatype: chromsizes
filetypes: chromsizes-tsv
A chromosome grid displays the boundaries of chromosomes on the 2D area. Its data is sourced from a standard chromSizes file containing chromosome names and chromosome files. The file can be ingested by the higlass server like any other tileset. As long as the datatype is set to chromsizes this track should be selectable from the “Add Track Dialog”.
To find the chromosome grid in the list of tracks, search for “chromosomes” when adding a track to the center view.
Stacked Bars

track-type: horizontal-stacked-bar
datatype: multivec
Stacked bar tracks display multivec data. They show multiple values at every location in the data by using a set of vertically stacked bars. There is an option to pick ‘unscaled’ and ‘scaled’ representations, which scale the height of the bars to the maximum and minimum value in all visible tiles or to fit the height of the track, respectively.
Multiple Lines

track-type: basic-multiple-line-chart
datatype: multivec
Displays multivec data by showing multiple values at every location using a number of line graphs.
Multiple Bar Charts

track-type: basic-multiple-bar-chart
datatype: multivec
Displays multivec data by showing multiple values at every location using a number of bar graphs.
1D Annotations

track-type: horizontal-1d-annotations and vertical-1d-annotations
datatype: none
Displays absolute positioned 1D annotations on horizontal and vertical 1D tracks
as well as 2D tracks. This track can be used to permanently highlight 1D regions
in any kind of dataset. The data is directly passed in via the regions
parameter of the options.
Example:
{
  uid: 'selection-a',
  type: 'horizontal-1d-annotations',
  options: {
    regions: [
      [230000000, 561000000],
    ],
    minRectWidth: 3,
    fillOpacity: 0.1,
    stroke: 'blue',
    strokePos: ['left', 'right'],
    strokeWidth: 2,
    strokeOpacity: 0.6,
  }
}